Debugging python script in cadwork
This section refers to calling the plugins from the Plugin Bar.
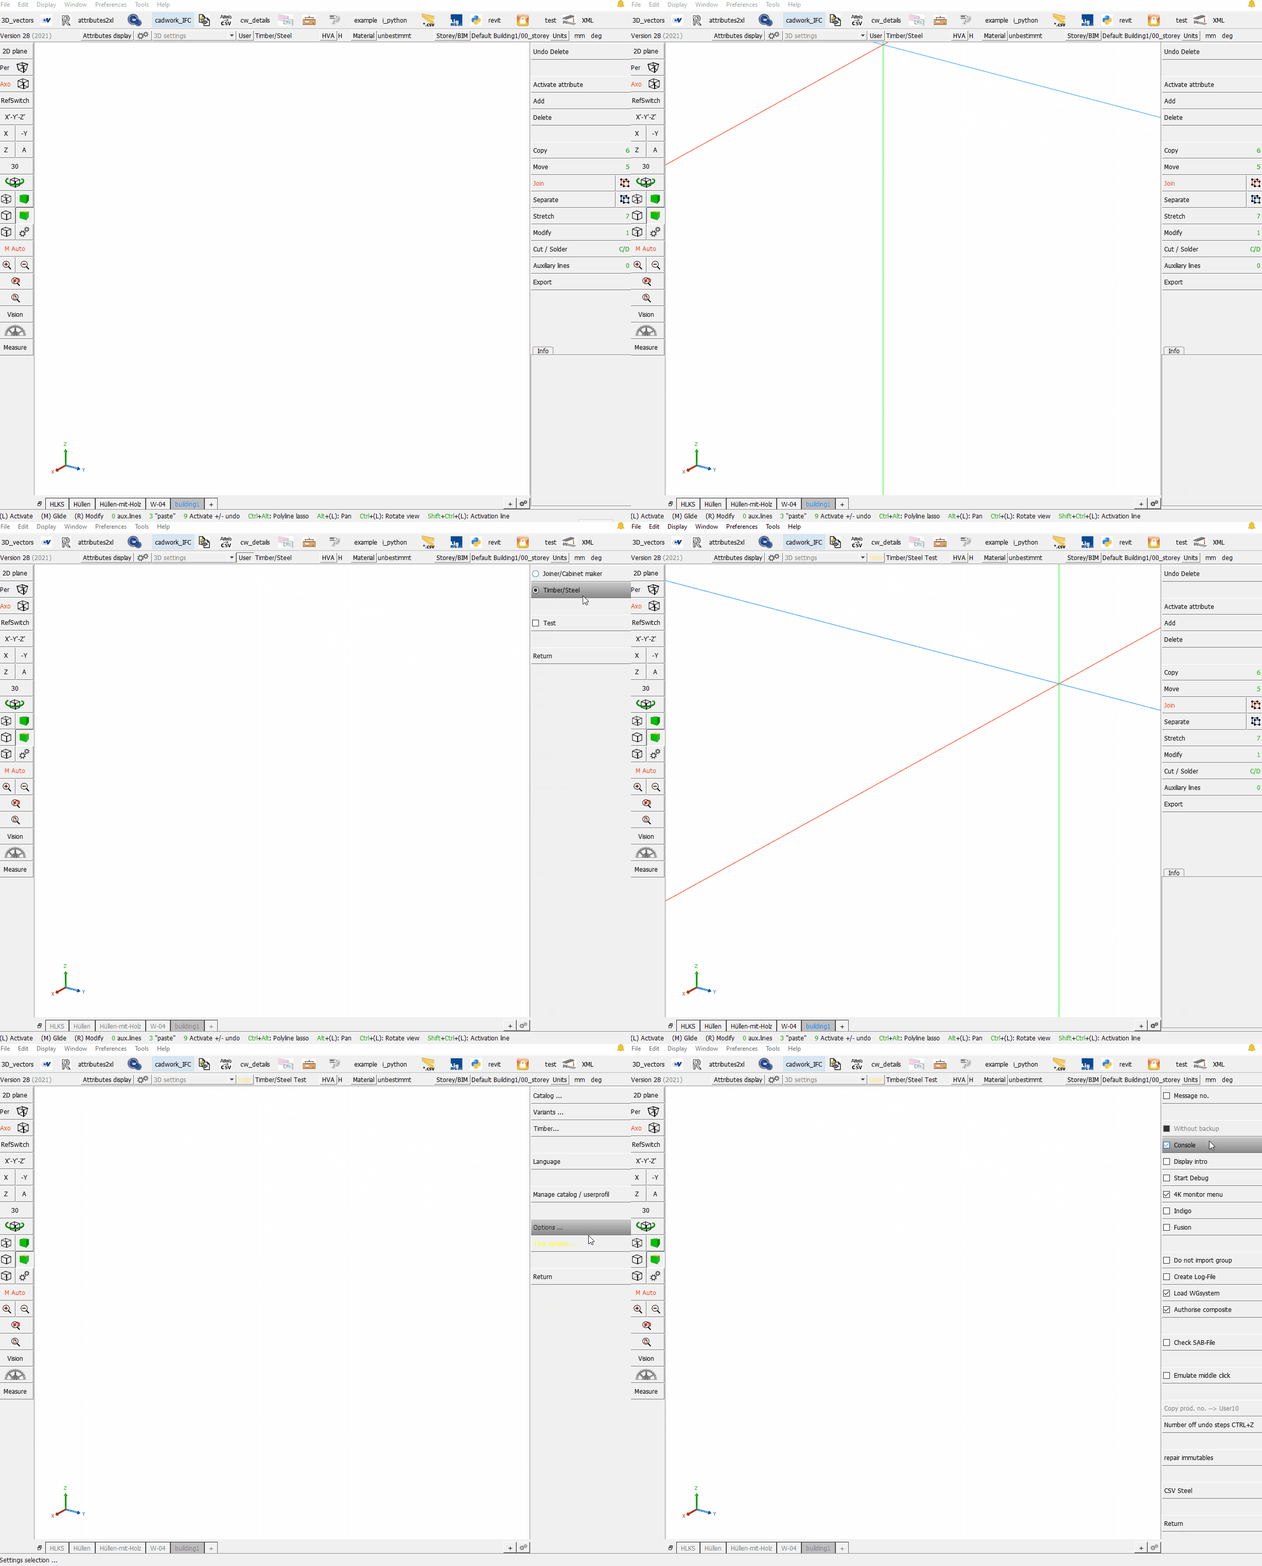
If you want to debug a script in cadwork, then you can enable the console in User Test in the user settings. When cadwork is restarted, the console opens.
In the console you will see the screen output, or errors.
User Test -> Userprofile -> Test Options... -> Console

Console
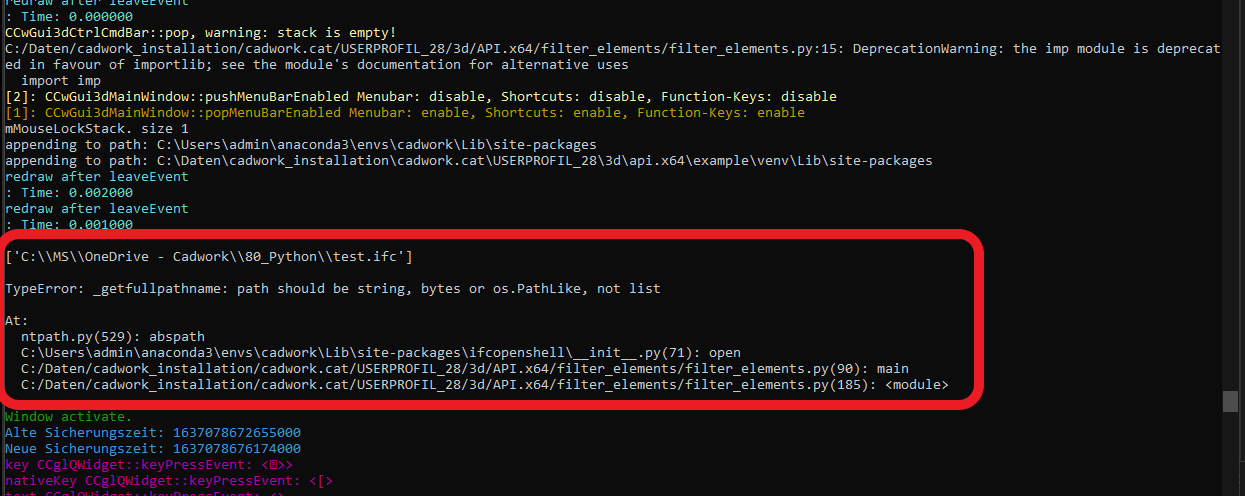
Bugs present in the script can be detected in the console.
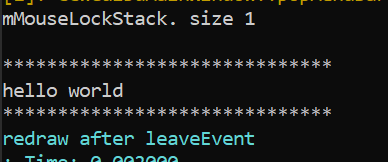
Any print statements are also visible in the console.
1 | |
Print output in console:

Displayed Bug in console:

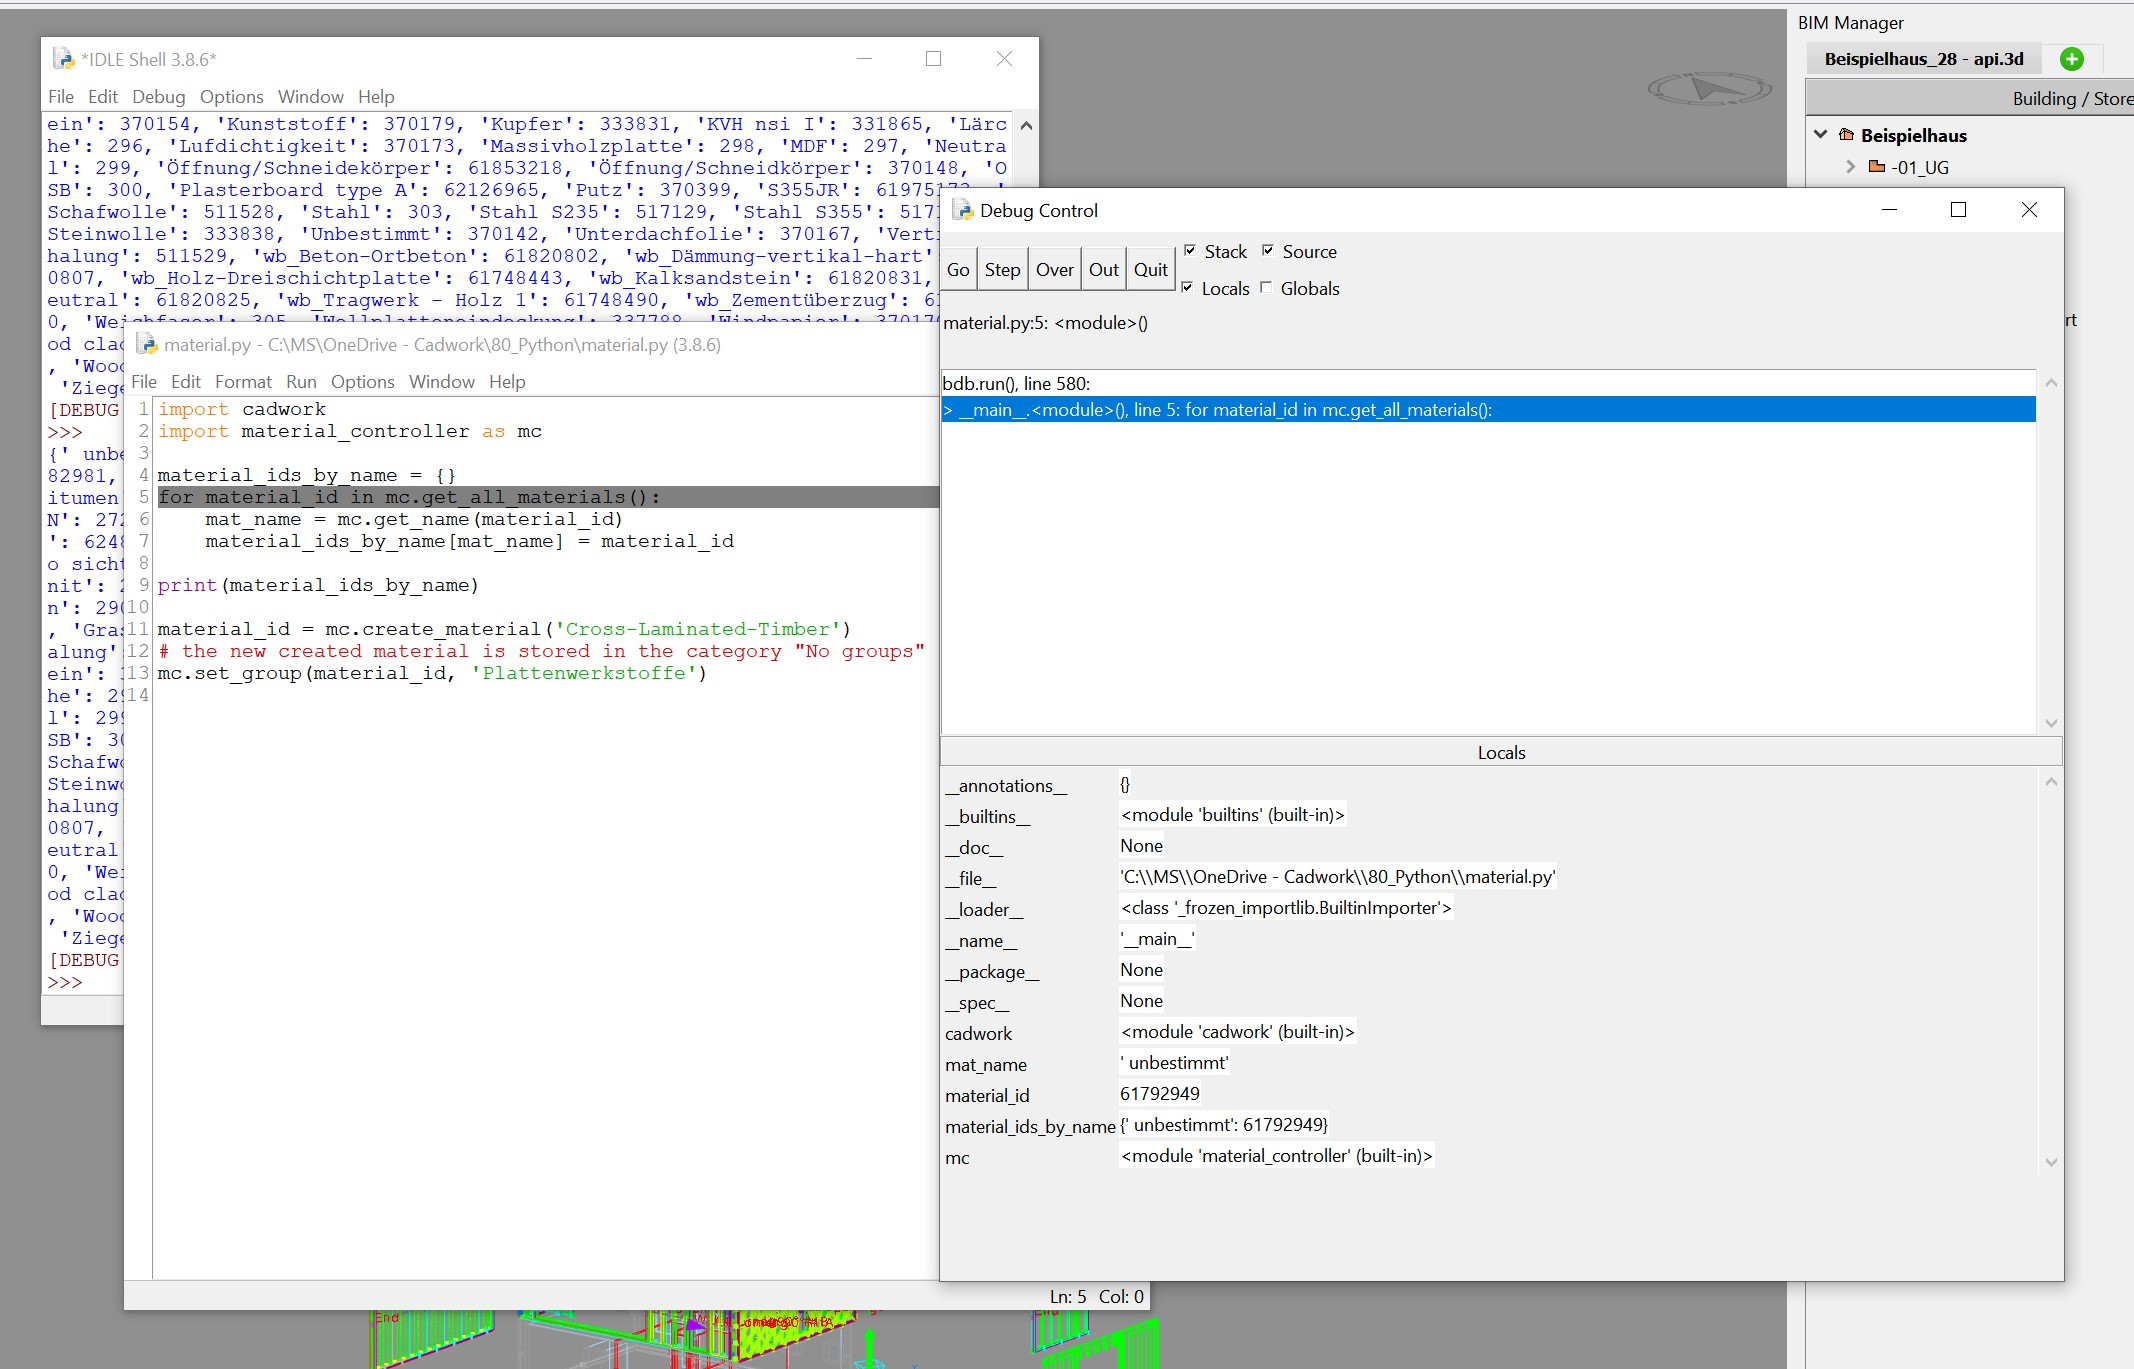
or use the debugger from Python IDLE.

Pycharm Professional
Remote debugging with the Python remote debug server configuration
Pycharm debug server configuration 💡
- Install the pydevd-pycharm package on the remote machine by running the following command:
pip install pydevd-pycharm~=
for example, pip install pydevd-pycharm~=191.3490)
- Modify the source code file as follows:
1 2 3 4 5 6 7 8 9 10 11 12 13 14 15 16 17 18 19 20 21 22 23 24 25 26 27 28 29 30 31 32 33 | |